Google App Engine(GAE)で作成したサービスのアクセスエラー率を可視化・アラート通知する方法
2023.04.11
PaaS系のサービスであるGoogle App Engine(以下、GAE)を運用している方の中には、どのような形でアプリケーションの異常に気が付けるか、それを設定する方法でお悩みではないでしょうか。
この記事では、Cloud Monitoringで可視化やアラート通知を行う方法について解説します。
はじめに
サーバーレスでアプリケーション開発に集中できる仕組みが整っているGoogle App Engine(以下、GAE)ですが、実際にサービスインしたいけど「適切な監視方法が応答監視ぐらいしか思いつかない」「もう少し詳細な監視をしたい」とお悩みの方も多くいらっしゃるのではないでしょうか。
そこで今回は、Cloud Monitoring(以下、Monitoring)を利用した可視化や監視方法について解説します。
記事前半ではダッシュボードで可視化する方法を、後半ではアラート通知する方法をお伝えするので、是非じっくりとご覧ください。
Google App Engine(GAE)とは
GAEとはGoogleが提供するGoogle Cloudのサーバーレスサービスのひとつです。
JavaやPython、Node.jsなど好きな言語で作成したWebアプリケーションをGoogleが管理するサーバーに簡単にデプロイできるPaaS系のプラットフォームです。
GAEにはスタンダード環境とフレキシブル環境の2つの環境が次のような特徴があります。
1. スタンダード環境
2. フレキシブル環境
Google Cloud ダッシュボードで可視化する方法
続いて、Monitoringのダッシュボードで可視化する方法をお伝えします。
実際に監視対象となる環境を用意したいので公式で用意されている環境でアプリケーションを用意しましょう。
環境
・GAEの環境の種類:フレキシブル
・Python:3
アプリケーションの用意が終わりましたらダッシュボードの作成に移ります。
Monitoring > ダッシュボード
ダッシュボードを作成します。
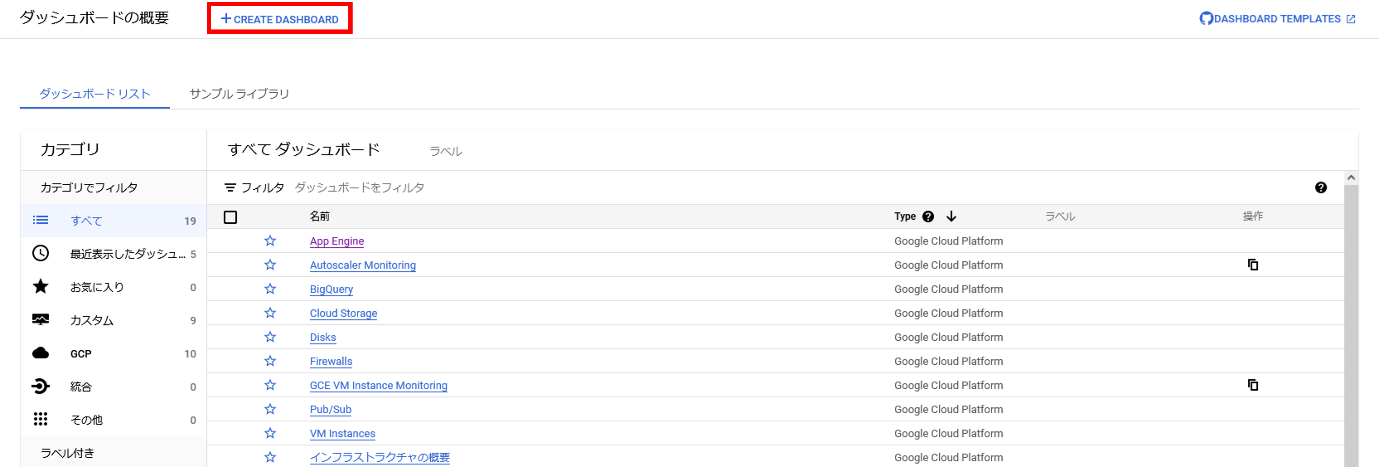
グラフを追加します。

今回は作成したアプリケーションへのアクセスの何割がクライアントエラーであったか表示するグラフを作成します。
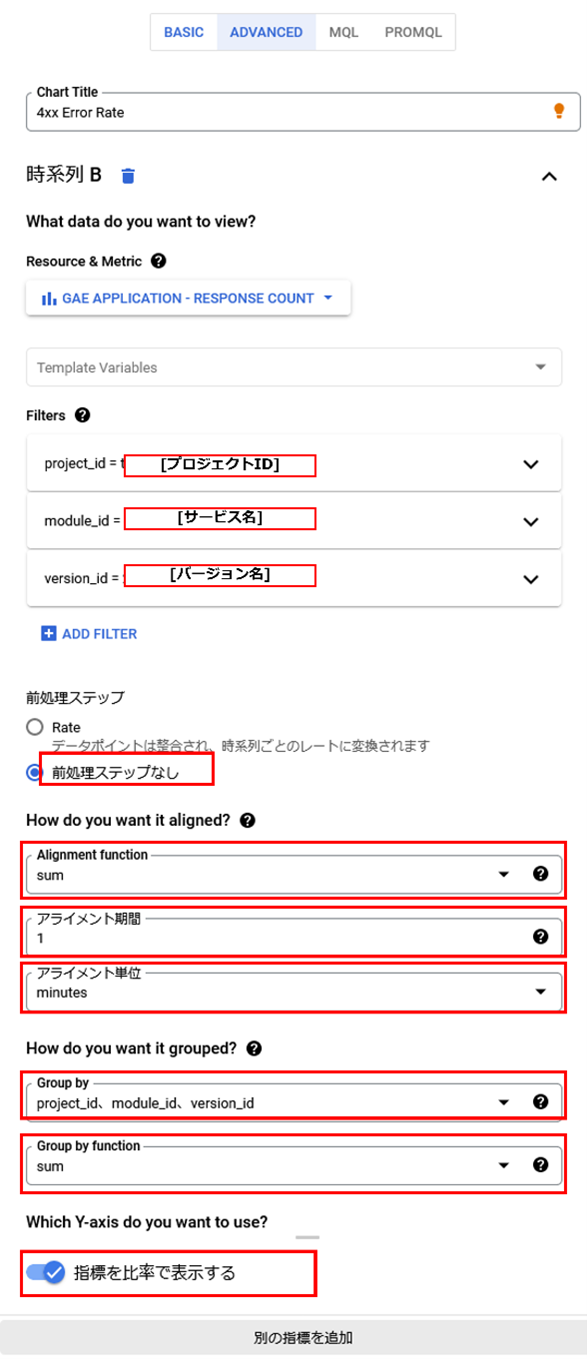
まずはレスポンスコードが400系のエラー数を分単位で集計するよう次のように設定します。
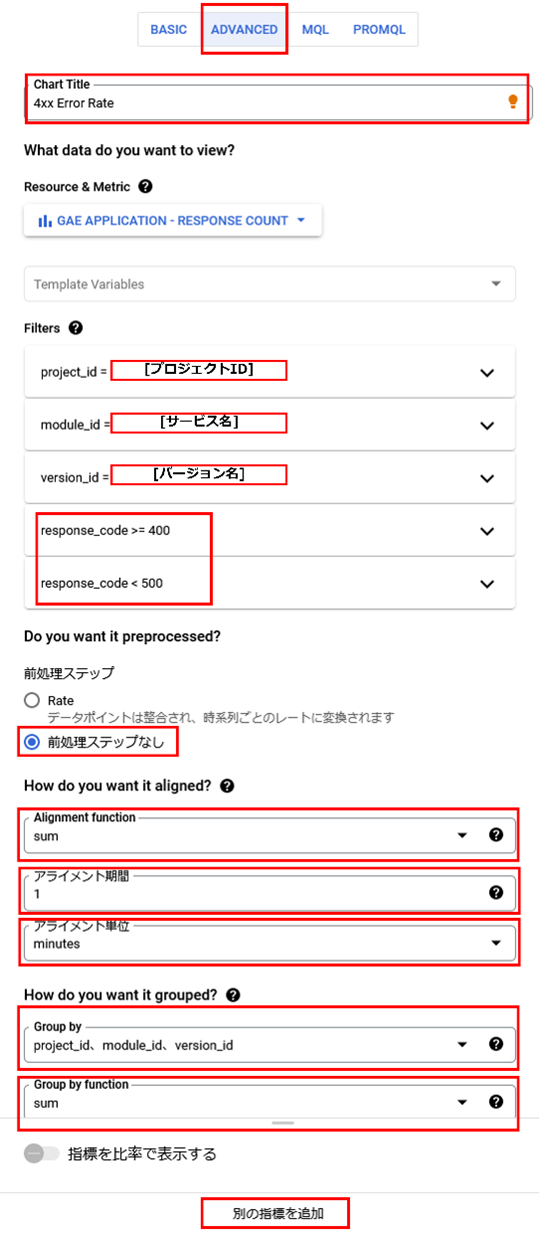
各入力値の設定内容については以下の通りです。
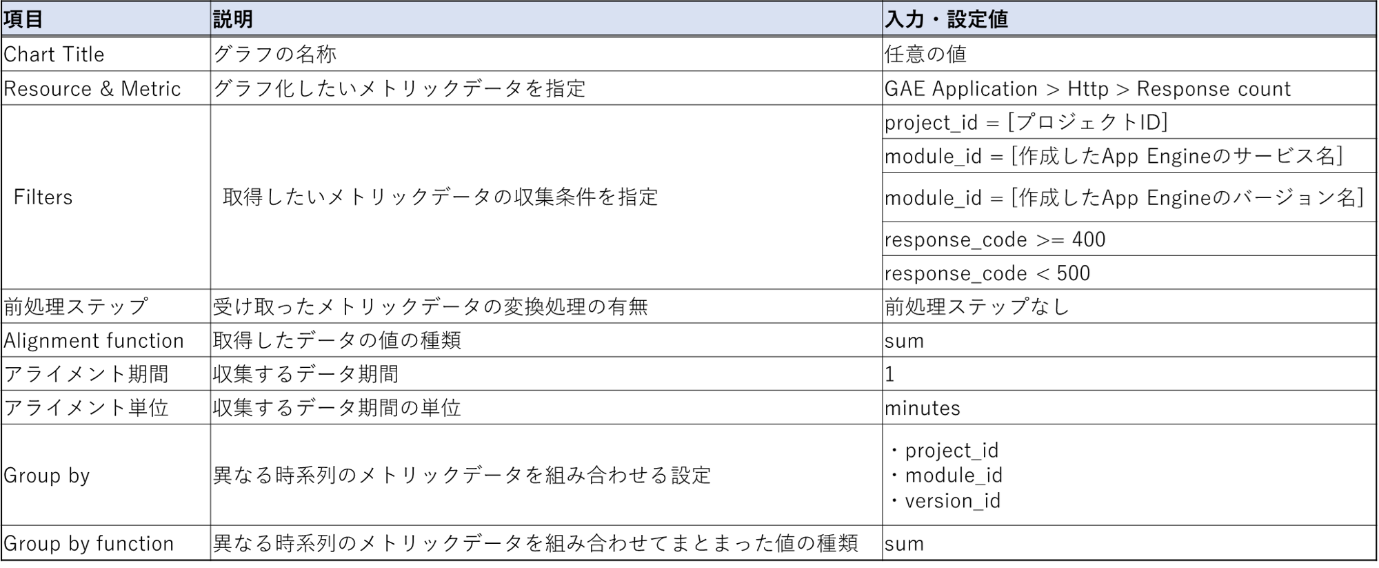
フィルター設定を行うことで特定のアプリケーションやレスポンスコードの折れ線グラフ化することができます。
さらにグルーピングを行うことで一つの線にまとめて表示することができます。
今回はクライアントエラーの比率を可視化したいので「別の指標を追加」をクリックし、分母となるメトリックデータの収集設定を行います。
先述の設定が異なる箇所はFiltersのresponse_codeの条件を指定しないことです。
エディタを閉じると次のようなグラフが作成され、可視化することが出来ます。
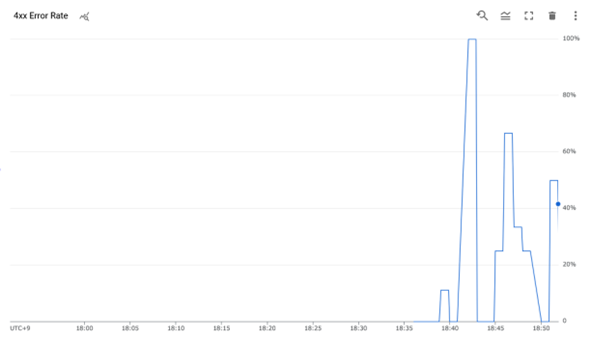
以上で、アプリケーションへのアクセスの何割がクライアントエラーであったか表示するグラフの作成が完了いしました。以降ではアラート通知する方法を試していきます。
アラート通知する方法
Monitoringで通知チャンネルの設定とポリシーの作成を行い、アラート通知する方法をお伝えします。
まずは通知先となるチャンネル(Eメール) の作成を行います。
GCPコンソールにログインし、Cloud Shellを起動します。
通知先を設定するためのファイルを作成します。
$ vim email-channel.json
{
    "type": "email",
    "displayName": "email alert notifications",
    "description": "for app engine 400s error rate notification",
    "labels": {
        "email_address": "通知先のメールアドレス"
    }
}
作成したファイルを使ってEメールの通知チャンネルを追加します。
$ gcloud beta monitoring channels create --channel-content-from-file="email-channel.json"
設定がうまく行われた場合、次のようなメッセージが表示されます。
Created notification channel [projects/<プロジェクトID>/notificationChannels/<識別子>] .次にアラートポリシーを作成します。
今回はクライアントエラーが30%を超えた場合にアラートを通知するようにポリシーを設定します。
$ vim monitoring-policy_4xxErrorRate.json
{
    "displayName": "HTTP 400s error rate",
    "combiner": "OR",
    "conditions": [
        {
            "displayName": "App Engine HTTP 400s error rate exceeds 30 percent",
            "conditionThreshold": {
                 "filter": "metric.label.response_code>=\"400\" AND
                            metric.label.response_code<\"500\" AND
                            metric.type=\"appengine.googleapis.com/http/server/response_count\" AND
                            project=\"[プロジェクト名]\" AND
                            resource.type=\"gae_app\"",
                 "aggregations": [
                    {
                        "alignmentPeriod": "300s",
                        "crossSeriesReducer": "REDUCE_SUM",
                        "groupByFields": [
                          "project",
                          "resource.label.module_id",
                          "resource.label.version_id"
                        ],
                        "perSeriesAligner": "ALIGN_DELTA"
                    }
                ],
                "denominatorFilter": "metric.type=\"appengine.googleapis.com/http/server/response_count\" AND
                                     project=\"[プロジェクト名]\" AND
                                     resource.labels.version_id = \"[バージョン名]\" AND
                                     resource.labels.module_id = \"[サービス名]\" AND
                                     resource.type=\"gae_app\"",
                "denominatorAggregations": [
                   {
                      "alignmentPeriod": "300s",
                      "crossSeriesReducer": "REDUCE_SUM",
                      "groupByFields": [
                        "project",
                        "resource.label.module_id",
                        "resource.label.version_id"
                       ],
                      "perSeriesAligner": "ALIGN_DELTA"
                    }
                ],
                "comparison": "COMPARISON_GT",
                "thresholdValue": 0.3,
                "duration": "0s",
                "trigger": {
                    "count": 1
                }
            }
        }
    ],
    "notificationChannels": "projects/[プロジェクトID]/notificationChannels/[作成した通知チャンネルID]"
}
作成したファイルを使ってアラートポリシーを追加します。
$ gcloud alpha monitoring policies create --policy-from-file="monitoring-policy_4xxErrorRate.json"
設定がうまく行われた場合次のようなメッセージが表示されます。
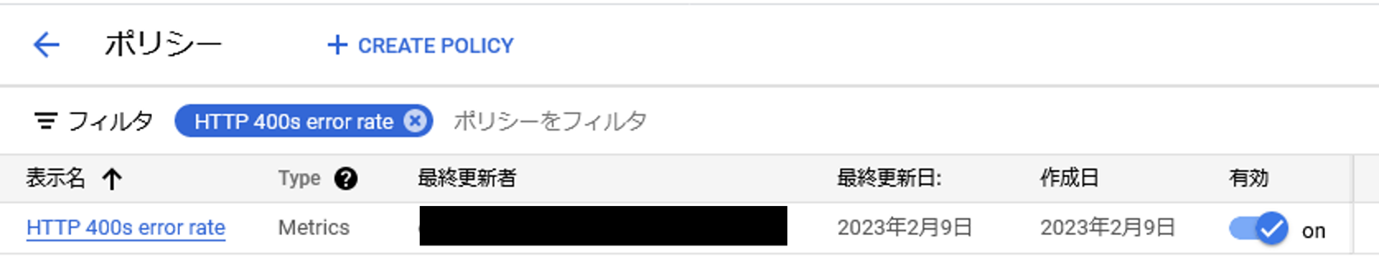
Created alert policy [projects/<プロジェクトID>/alertPolicies/<識別子>] .また、Monitoringコンソールで確認するとポリシーが設定されていることが確認できます。
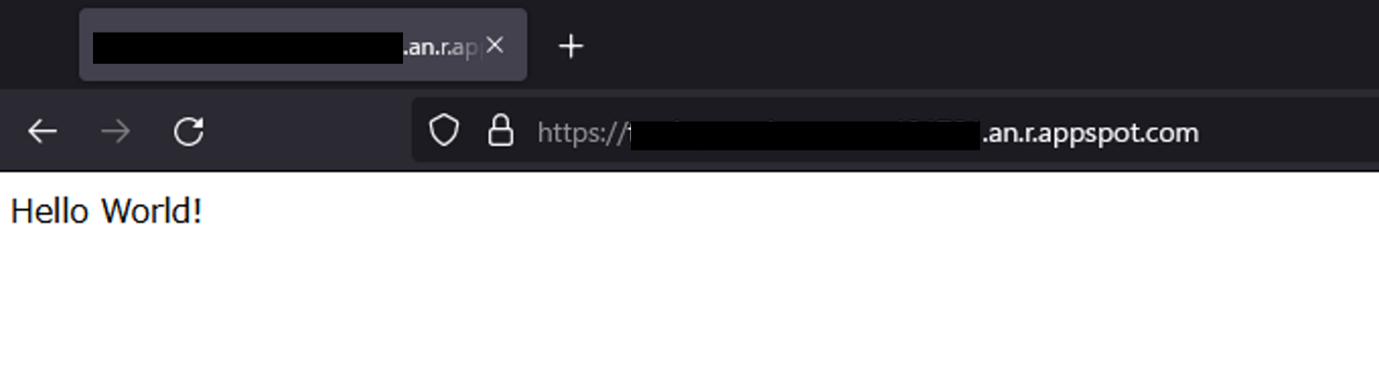
今度は作成したアプリケーションにアクセスし、通常のアクセスとクライアントエラーが発生するアクセスを行い、エラー比率に応じてアラート発生するか確認してみます。
通常のアクセス:https://[プロジェクトID] .an.r.appspot.com
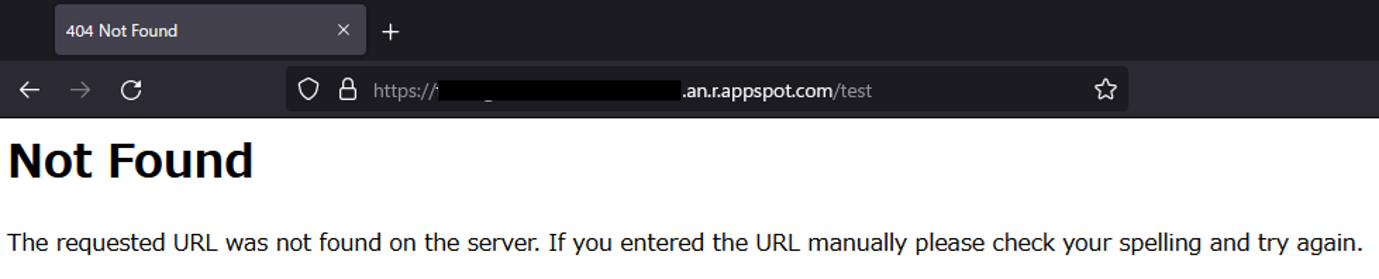
クライアントエラーが発生するアクセス(404エラー):https://[プロジェクトID] .an.r.appspot.com/test
すると、ポリシーで表示されるグラフは次のように表示されます。(緑枠参照)
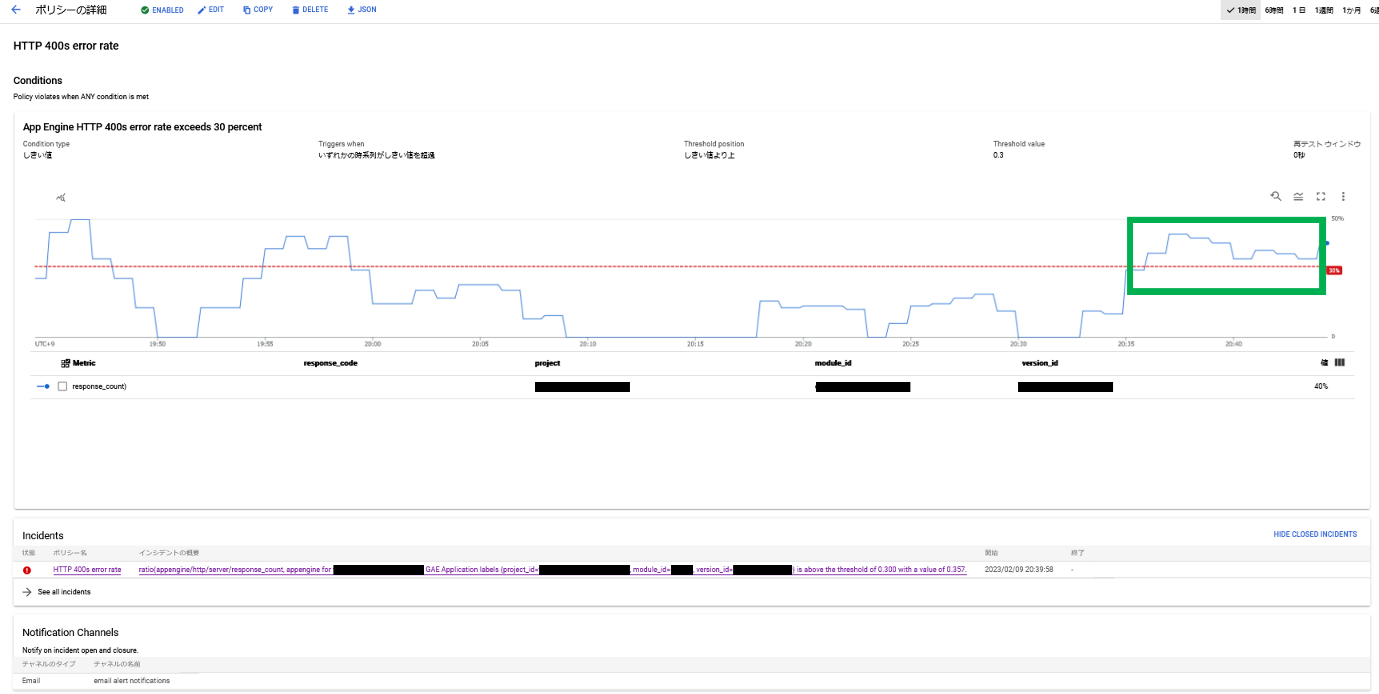
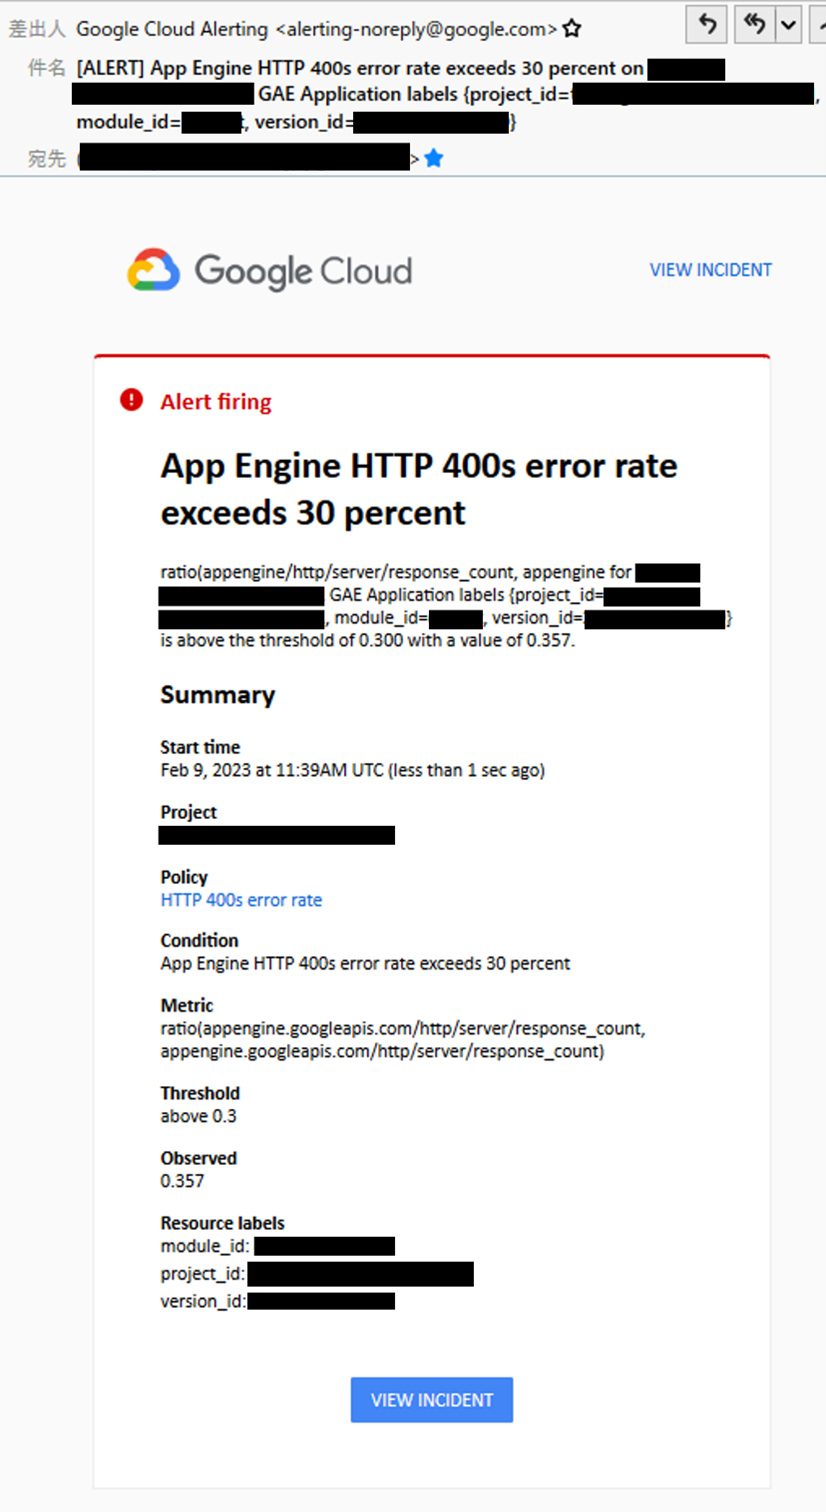
クライアントエラーの割合の閾値が30%で設定されていることが確認でき、実際に次のようなアラートメールを受け取ることができます。
以上で、Monitoringで通知チャンネルの設定とポリシーの作成を行い、アラート通知する方法が完了しました。
終わりに
今回は、GAEで作成したアプリケーションのクライアントエラーの比率を一例にMonitoringダッシュボードで可視化する方法やMonitoringポリシーでアラート通知する方法をご紹介いたしました。フィルター条件を変更することでサーバーエラー比率の可視化や監視が行うことができます。
また、通知チャンネルはEメールに限らずPub/SubやSMS、Slackなどへの通知も可能です。
実際に検証してみた結果、比率のグラフ化は行えてもアラート通知させるためには設定ファイルを用意しgcloudで設定する必要があるため、設定ファイルで定義した内容を理解し、Aggregationの概念的な理解が求められると、取り掛かりにくいと感じてしまいました。
そのため、公式ドキュメントや噛み砕いて表現してくれる情報をもとに理解を深めながら設定を進めていきました。
参考サイト:
App Engine 環境を選択する(Google Cloud公式)
App Engine フレキシブル環境で Python アプリを作成する(Google Cloud公式)
HTTP エラーの比率(Google Cloud公式)
Google Cloud Monitoring の Aggregation を理解する